|
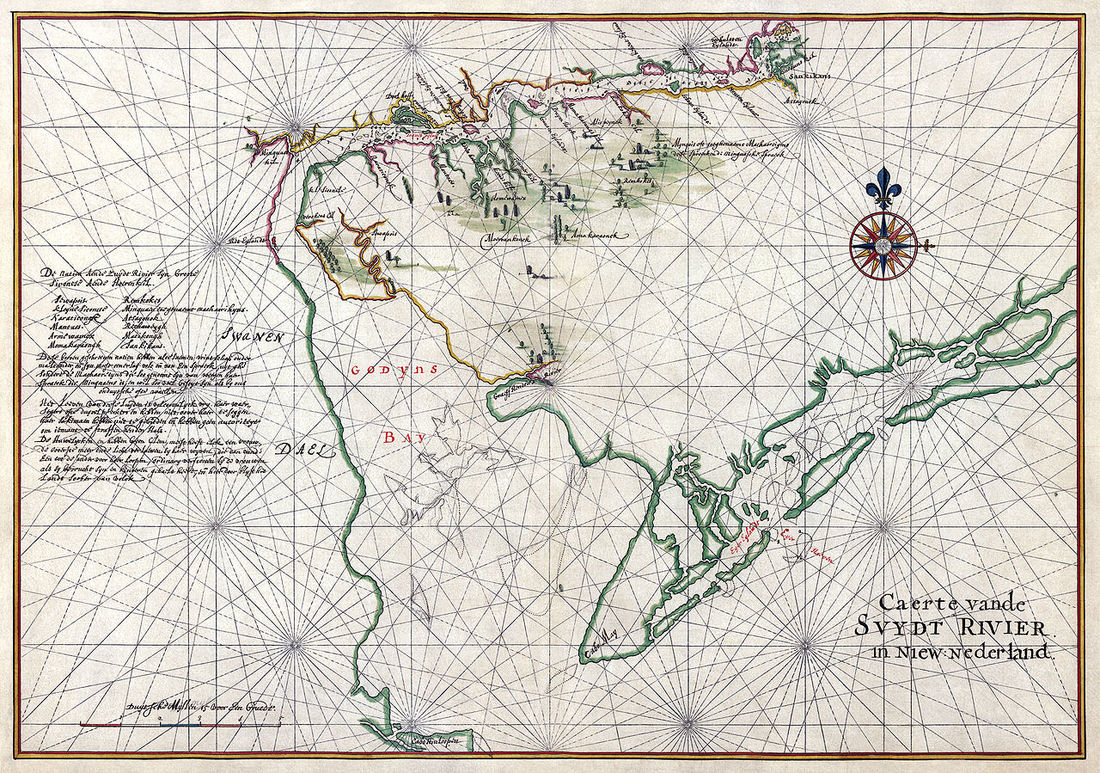
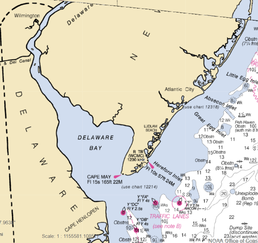
Have you ever wondered how hydrographers create accurate depictions of the coastline on their nautical charts? In modern surveys we utilized photogrammetry (aerial photographs) of the coastline or, more recently, LIDAR (Light Detection and Ranging) to produce shoreline on nautical charts, but how did the sailors making those nautical charts from the 1600s to the early 1900s do it? In the earliest days of exploration charts were often made by estimation. Using the ship’s log, which would include important observations and the ship’s navigation information, one could approximate the shape of the coastline for the purposes of creating a nautical chart. This was inexact at best and resulted in some crude approximations of the actual coastline, as can be seen below in a chart from the 16th century. 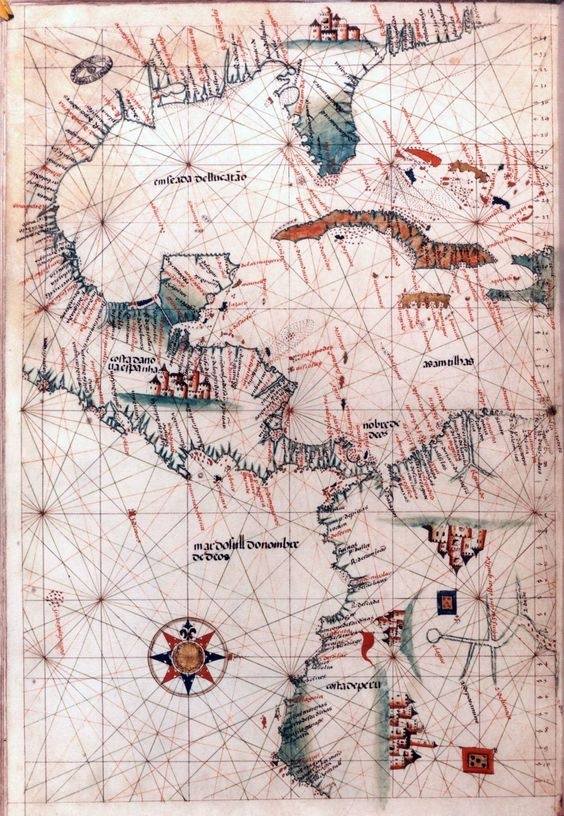 As you move into the 17th century, there were some purposeful hydrographic surveys that were conducted to chart coastline accurately. The British Navy began a detailed survey of their coast in the 1680s and produced some very accurate shorelines. The image below is of Delaware Bay and was produced in 1630s, which is pretty accurate compared to a contemporary chart of the same area.
So how did they do it? The answer is Plane Table Mapping. Plane table mapping utilizes a table affixed to the top of a tripod on which to plot positions and a telescopic alidade to get bearings to the features you’re trying to position. 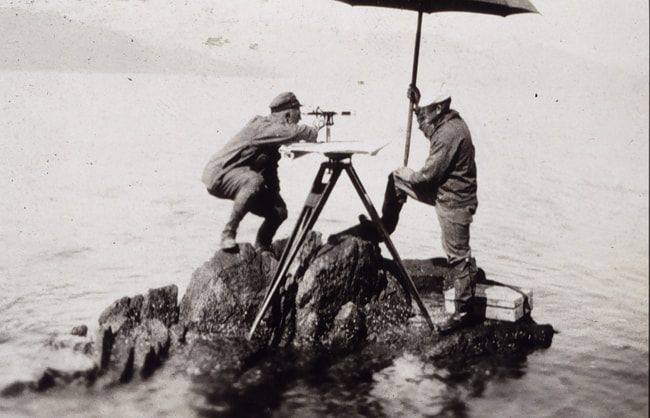 The image above is from the NOAA archives and shows a US Coast and Geodetic Survey team utilizing a plane table to chart the coastline in Alaska. At its most basic, plane table mapping is simply triangulation. From a known location, you can shoot the angle/bearing to a prominent feature, then you can either measure the distance to that feature or you can shoot another angle to that feature from another known location. Either way (with a line of position and a range or two lines of position), you fix that feature in relation to known locations. By fixing several points along the shoreline, you can then generate the overall shape of that shoreline. The simple example below shows the mapping of a courtyard by taking bearings from two known points a set distance apart (the baseline). 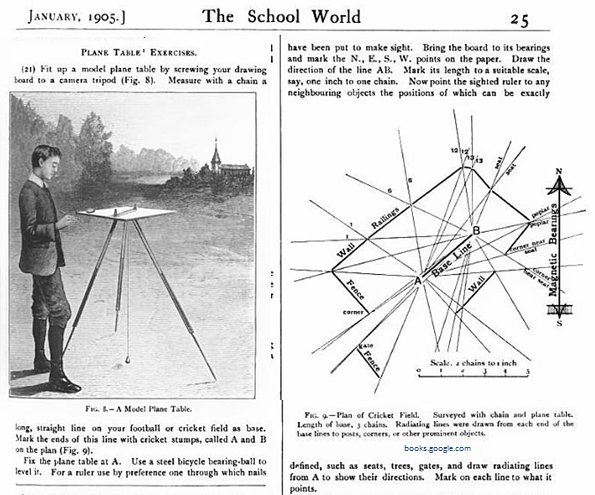 There is a great article on the history of the plane table at the link below:
Plane Table Mapping I think it’s really quite fascinating, but maybe that’s just me. Until next time, here’s wishing you fair winds and following seas.
3 Comments
Matt
5/8/2018 08:25:13
Wow! I really enjoyed your description of traditional methods. What a neat way to connect to our country’s beginning.
Brent Pounds
5/8/2018 15:10:05
Yeah, the Coast Survey, one of the predecessor agencies that formed what is now NOAA, is the oldest US government scientific agency (take USGS) and was created by Thomas Jefferson in 1807.
Brent Pounds
5/31/2018 13:19:47
Just noticed the e-mail on your comment; good to hear from you Matt, hope all is going well at USACE. My brother lives down in your neck of the woods. Leave a Reply. |
AuthorBrent Pounds has over a decade of experience in the maritime industry and has been involved in recreations boating since he was a child. See the About section for more detailed information. Archives
October 2016
Categories
All
|
 RSS Feed